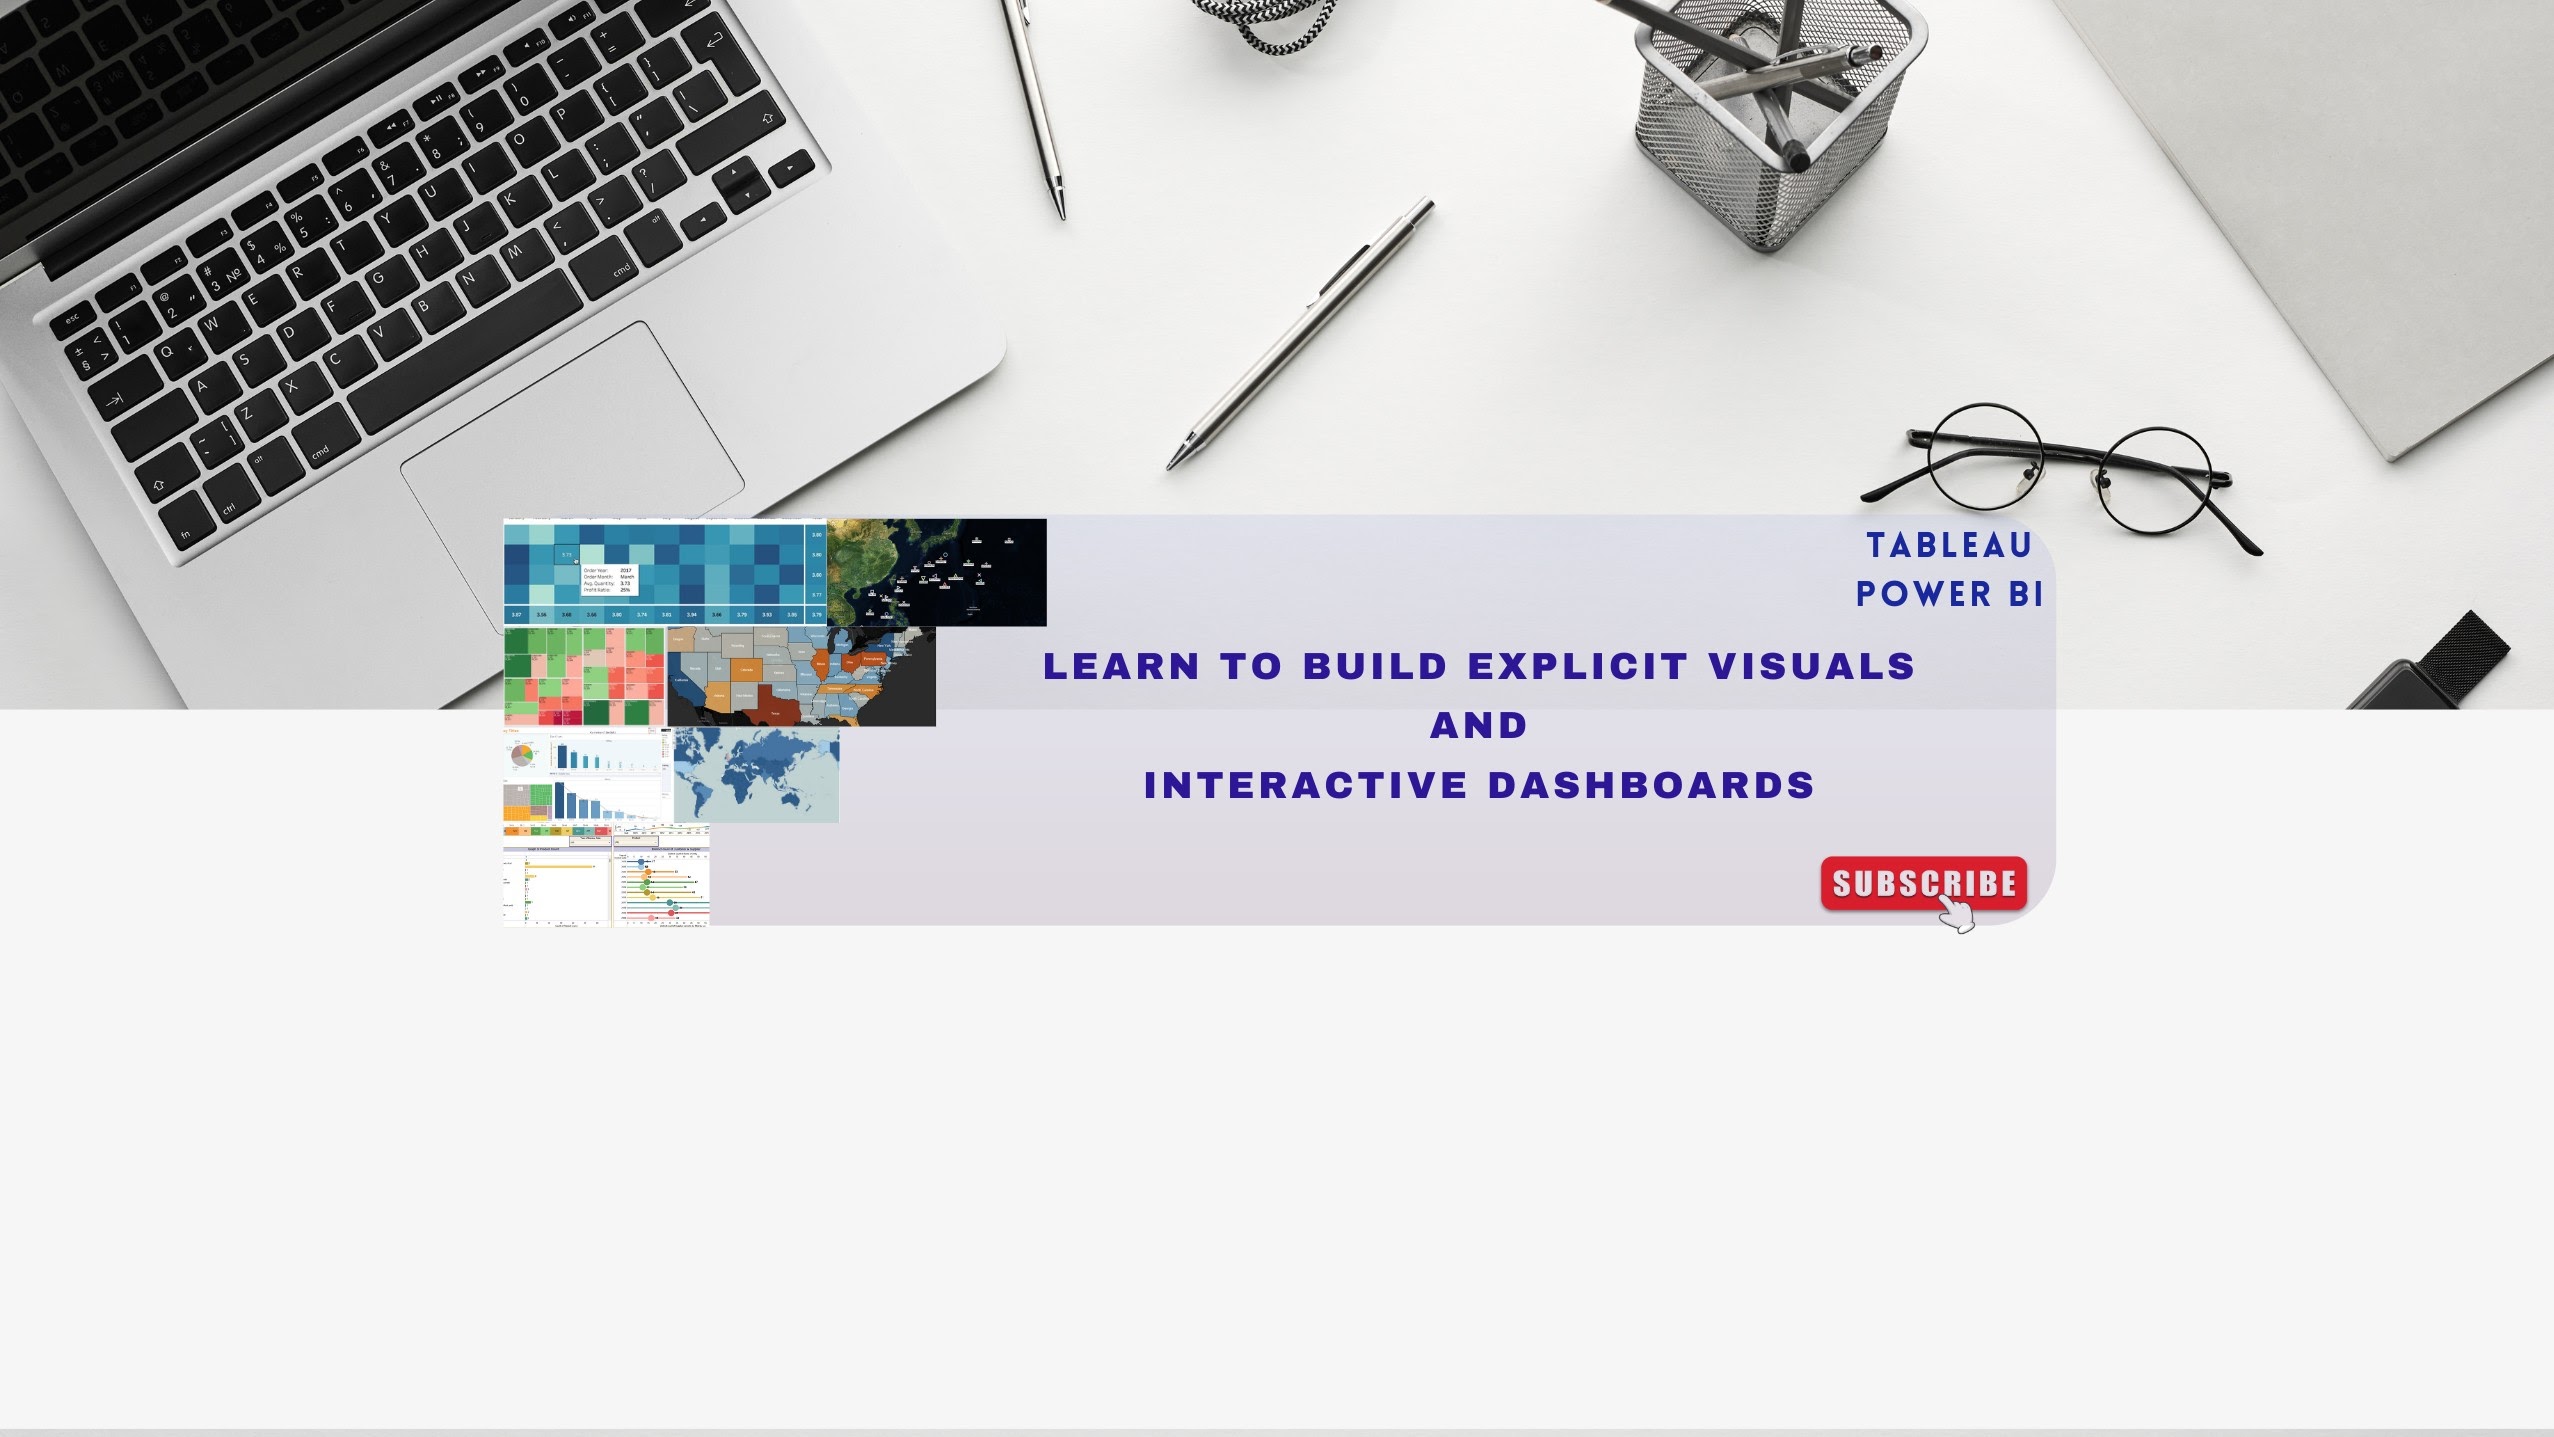

Data Visualization
@dataviz_tutorialData Visualization is a Education and Tech YouTube creator with 2.7K subscribers and 314K total views. The channel covers data visualization, business intelligence tools, tableau tutorials, power bi training, excel tutorials. Active for 5 years, the channel publishes about 3 videos per month. Videos average 1.9K views each. Based in India, the channel's primary language is English. YouTube channels with 1K–10K sub channels typically charge between $50 and $500 per sponsored video. Book a sponsorship directly on TrySpansa.
Niches
About
One stop to learn all about Data Visualization using Tableau, Excel and Power BI. Data visualization is not only a powerful tool for understanding and communicating information, but also a form of art that can captivate and inspire. Get to know how to create unique, compelling visuals and bring them together in an interactive dashboard and get better insights along with that you will get to learn best practices to make dashbord asthetics better along with optimizing its performance. Join us on the journey to learn all about data visualization from beginner to advance level using the top industry tools. Connect below for queries: Connect on Instagram for daily dose of learning:
Recent Videos
Channel data updated June 2026
Sponsorship Pricing
This creator hasn't set their rates yet. Estimate typical rates for their niche:
Rate Calculator
TrySpansa OriginalEnter your channel stats to estimate sponsorship rates.
● Free · No credit card required
Estimated pricing — negotiate directly
Topicsclassified by TrySpansa
Related Creators
Johnny Harris
7,780,000 subs
codebasics
1,540,000 subs

MineStats
1,520,000 subs

Nology - نولوجي
1,360,000 subs

GOTO Conferences
1,050,000 subs
Geography By Geoff
1,030,000 subs
Johnny Harris
7,780,000 subs
codebasics
1,540,000 subs
MineStats
1,520,000 subs
Nology - نولوجي
1,360,000 subs
GOTO Conferences
1,050,000 subs
Geography By Geoff
1,030,000 subs
Johnny Harris
7,780,000 subs
codebasics
1,540,000 subs
MineStats
1,520,000 subs
Nology - نولوجي
1,360,000 subs
GOTO Conferences
1,050,000 subs
Geography By Geoff
1,030,000 subs
Similar English Education Creators
Innovative Amazing Science With Sunayana Das
5,460 subs
Angela Learns Spanish
5,460 subs

Yakup Karaer
5,440 subs

Toon Gyan
5,430 subs
Kaelan Moss - MinuteAdmin
5,430 subs

PHP Technical & Framework
5,420 subs
Innovative Amazing Science With Sunayana Das
5,460 subs
Angela Learns Spanish
5,460 subs
Yakup Karaer
5,440 subs
Toon Gyan
5,430 subs
Kaelan Moss - MinuteAdmin
5,430 subs
PHP Technical & Framework
5,420 subs
Innovative Amazing Science With Sunayana Das
5,460 subs
Angela Learns Spanish
5,460 subs
Yakup Karaer
5,440 subs
Toon Gyan
5,430 subs
Kaelan Moss - MinuteAdmin
5,430 subs
PHP Technical & Framework
5,420 subs